With the advent of the knowledge base
economy, the role of technology in out society has become increasingly
important. In today's fast paced environment, more and more people are
reliant on high speed communication devices to keep up with the latest
news. Our problem in this projects lies in the poor
tuning of the matching between the amplifier and the front end. We have
to teach our test operators about impedance matching as they knew little
about it. Therefore we have design a web page especially for them to have
a hand on practical experiments on Smith Chart.
The diagram below is show the power
transfer between the front end and the
amplifier
Smith
Chart![]() click
here to download Smith Chart
click
here to download Smith Chart
In any transmission system,
a source sends energy to a load, such as an antenna. Ideally, we design
the transmission network such that the characteristic impedances of the
source, the transmission line and the load are all identical. Unfortunately,
many real world situations prevent the match from being perfect.
For example, we might want an antenna (the load) to be useful over a broad range of frequencies. But the characteristic impedance of an antenna is unlikely to stay constant with frequency, especially if the frequency span is great.
When the transmission line impedance does not match that of the load, part of the transmitted waveform is reflected back towards the source. The reflected wave, which varies in phase and magnitude, adds to the incident (transmitted) wave and the sum is called a Standing Wave.
The reflected wave causes the amplitude to vary as a function of position along the transmission line. The Standing Wave Ratio (SWR), which is the ratio between the maximum and minimum amplitudes of the total waveform, will in this case be greater than one.
If there is no reflected wave, i.e., if the impedance match is perfect, the amplitude of the total waveform (incident plus reflected wave) will be the constant, regardless of where we measure it along the transmission line. The result is a SWR of 1. SWR = 1 indicates maximum power transfer to the load.
SWR can be inferred by measuring the reflection coefficient of the circuit. The network analyzer is a tool that enables us to do just that.
If we know the reflection coefficient, we can determine the characteristic impedance of the load by using a Smith Chart. The Smith Chart has circles of constant resistance and arcs of constant reactance. The relationship between reflection coefficient and characteristic impedance is shown in the diagram. At first glance, the Smith Chart appears complicated, but its elegance soon becomes obvious.
The Smith Chart can help us translate the reflection coefficient into impedance. First, measure the reflection coefficient with a network analyzer (or invent one of your own choosing). Place the reflection coefficient, by using either the mouse or the drop-down input boxes, at the desired value (real + imaginary) on the Smith Chart. Hit the Play button (triangle), and the program will display a circle with a radius equal to the reflection coefficient magnitude (constant VSWR circle). Notice that if you move the reflection coefficient anywhere on this circle, you can see from the waveform at the left that the SWR is the same, only its phase changes. (Phase values are not shown around the chart in this program; however, the phase is calculated and shown at the left side of the screen.)
In general, only the horizontal line (diameter) is labeled with (normalized) resistance values and only the unit (outer) circle is labeled with (normalized) reactance values. To read the desired values, it is necessary to follow the appropriate circle of constant resistance to the diameter line, and to follow the appropriate arc of constant reactance to the unit circle. Hit Play again, and the program will display the constant-resistance circle and the constant-reactance arc for you. (The actual values are calculated and shown at the left side of the screen.)
Experiment with the simulator and see if you can predict
the shape of the standing wave before you move the reflection coefficient.
Impedance
matching![]() Click
here to download Impedance / Smith Chart Matching Program
Click
here to download Impedance / Smith Chart Matching Program
Impedance matching on the Smith chart is a well established technique. the introduction of the Smith chart greatly simplified the time-consuming complex number calculations required for impedance transformations and provides a convenient graphical method of designing matching circuits.
Admittance varies along a constant
conductance circle (blue line). and the impedance varies along a constant
resistance circle
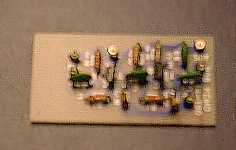 FUNCTION OF AMPLIFIER
Conclusion
After going through a more detail process in our web site, we believe that you should have a more focused and clear idea of why impedance matching is so important in matching network. If you are still unsure about anything, you could visit the following link which we believe can clear your doubt.
![]() RF GLOBAL NET
RF GLOBAL NET
![]() HP WEB SITE
HP WEB SITE